clear;
clf;
n=500;
a=6*pi;
freq = 20;
delta = a/n;
b=n+1;
hold off;
numframes = floor(b/freq)+1
M = moviein(numframes);
for k =1:b
t(k)=delta*(k-1);
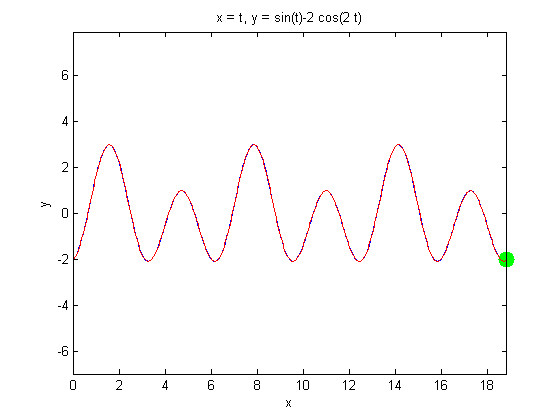
x(k)=sin(t(k))-2*cos(2*t(k));
end;
t=0:delta:a;
x=sin(t)-2*cos(2*t);
ybottom = min(x)
ytop = max(x);
xright = max(t);
xleft = min(t);
axis([xleft xright ybottom ytop])
grid on
ezplot('t','sin(t)-2*cos(2*t)',[0,6*pi]);hold on;
marker1 = line('color','g','Marker','.','markersize',40,'EraseMode','xor','xdata',t(1),'ydata',x(1));
graph1=line('color','r','Linestyle','-','erase','none','xdata',[],'ydata',[]);
j=0;
for k=1:b
X1(k)=t(k);
Y1(k)=x(k);
if(floor(k/freq)*freq == k)
set(graph1,'Xdata',[X1],'Ydata',[Y1]);
set(marker1,'XData',X1(k),'YData',Y1(k));
j=j+1
M(j)=getframe;
end;
end
set(graph1,'Xdata',[X1],'Ydata',[Y1]);
set(marker1,'XData',X1(b),'YData',Y1(b));
M(numframes)=getframe
movie(M,10);
numframes =

    26


ybottom =

   -2.0625


j =

     1


j =

     2


j =

     3


j =

     4


j =

     5


j =

     6


j =

     7


j =

     8


j =

     9


j =

    10


j =

    11


j =

    12


j =

    13


j =

    14


j =

    15


j =

    16


j =

    17


j =

    18


j =

    19


j =

    20


j =

    21


j =

    22


j =

    23


j =

    24


j =

    25


M =

1x26 struct array with fields:
    cdata
    colormap